The P&L journal for day traders

Know your numbers.
Every single day.

Log each day's profit or loss in seconds. The Trading Desk turns it into a green and red calendar, goals with the pace you need, a recap of every month, and your profit after expenses.

Built by a full-time trader, for traders
Trading Desk app showing a month of green and red trading days
Features

Everything you check after the bell

A calendar that tells the truth

1
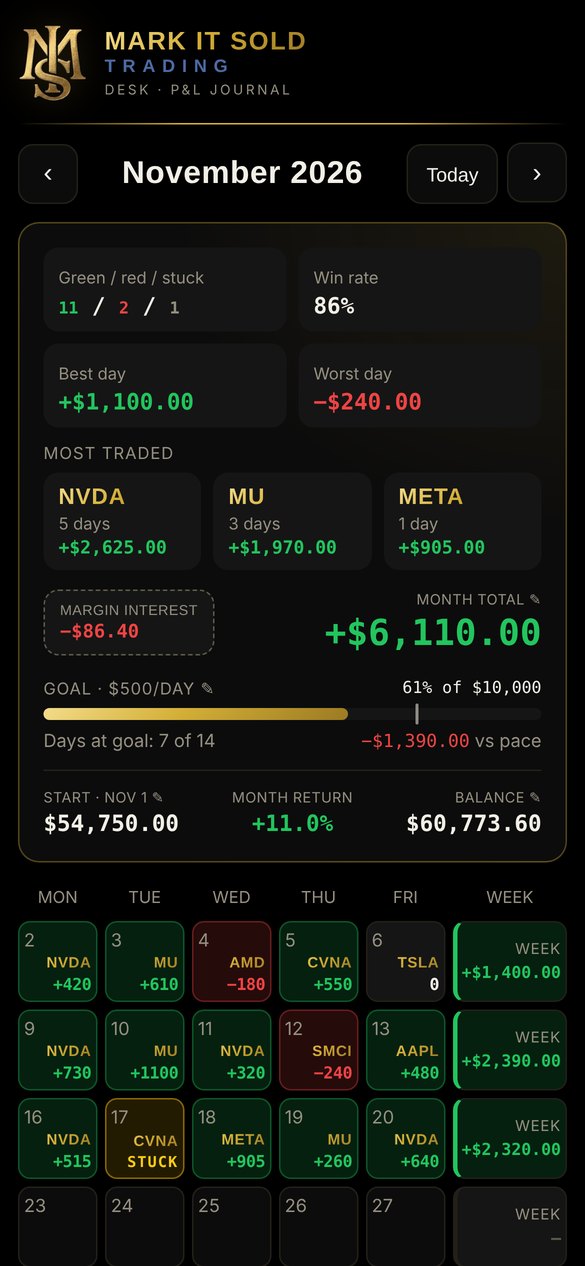
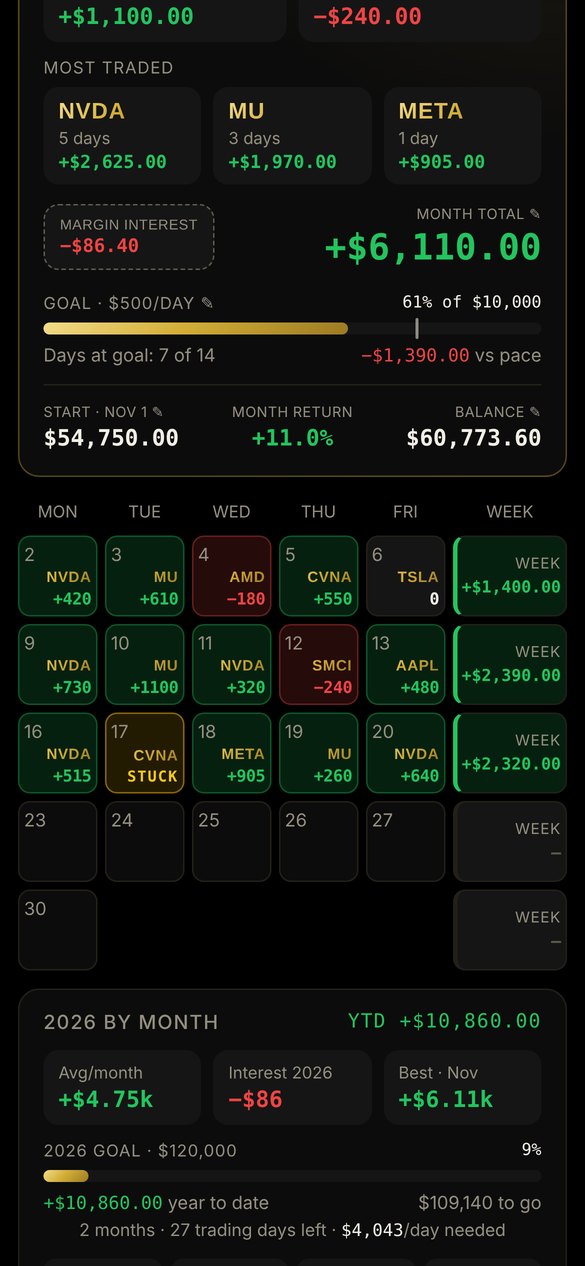
Green, red and stuck daysTap a day, enter your P&L and ticker. Mark days you're stuck holding a position in yellow.
2
Weekly totals and month statsWin rate, best and worst day, and your most traded stocks with what each made you.
3
Match your brokerType your month P&L or account balance and the app fills in the difference for you.
4
Margin interest tracked separatelyIt comes off your balance without skewing your trading stats.
Month calendar with green, red and stuck days
Sample data

Goals that keep you honest

1
Daily goal with a pace markerSee if you're ahead or behind the month's target, day by day.
2
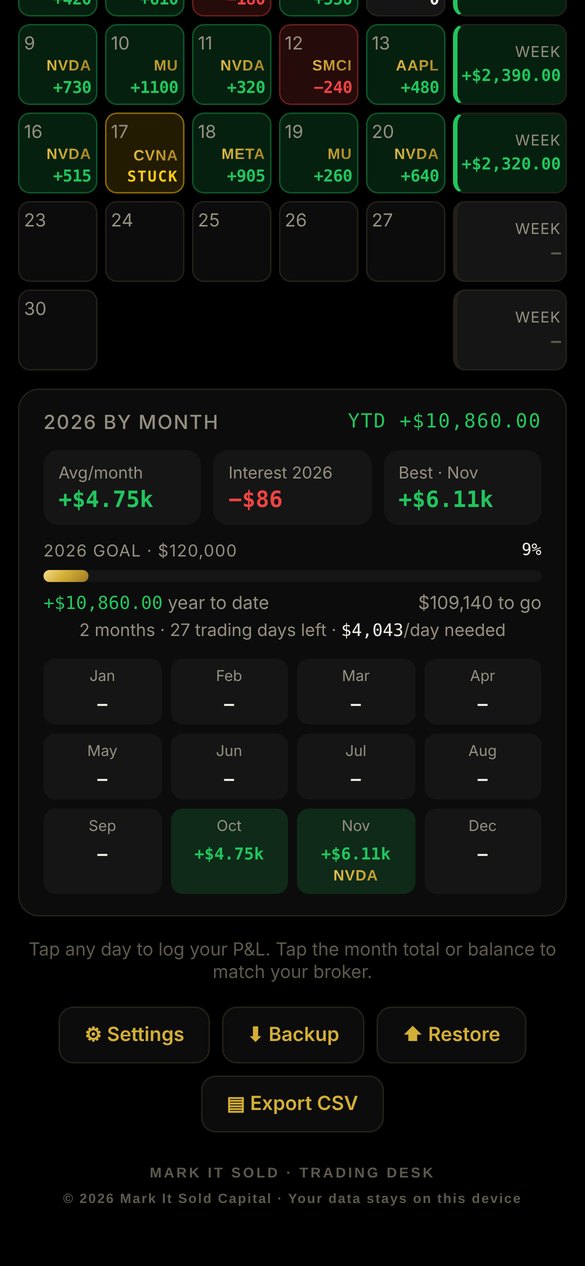
Yearly goal and $/day neededCalendar year or your company's fiscal year, with trading days left.
3
Monthly recapOn the 1st, last month counts up in gold: return, win rate, best day and top stock.
4
Your data, your deviceEntries stay private on your phone or computer. Back up, restore or export to Excel anytime.
Year view with monthly results and yearly goal
Sample data

Expenses on the back

1
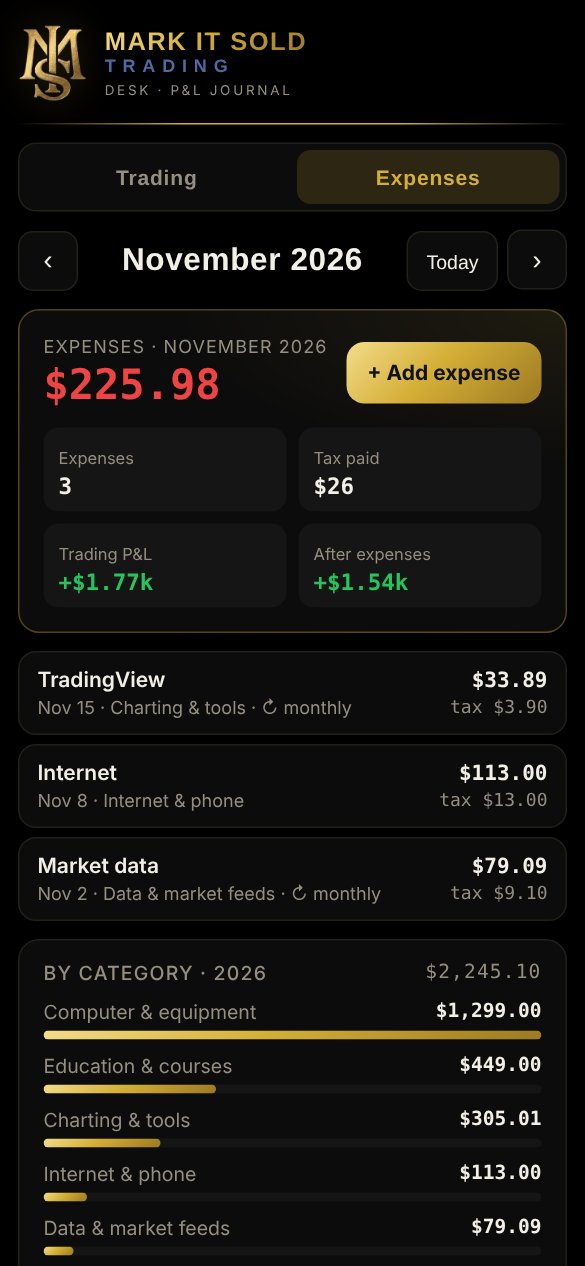
What your trading really costsLog data feeds, platforms, software, courses, internet and equipment in a second tab behind your calendar.
2
Profit after expensesSee your trading P&L, your costs and what's left, for the month and the year.
3
Sales tax kept separateRecord the HST or GST on each receipt (one tap for 13% or 5%), so you know what you can claim back.
4
One-tap accountant reportYour year's trading P&L, margin interest, expenses by category and tax paid, as a PDF or spreadsheet. Monthly bills can repeat automatically.
Expenses tab with monthly costs, tax paid and totals by category
Sample data
Pricing

One plan. Every feature.

Monthly

$9.99
per month + HST/GST · cancel anytime
Subscribe monthly
2 months free

Yearly

$99
per year + HST/GST · about $8.25/month
Subscribe yearly

Prices in CAD, plus HST/GST based on where you live. Renews automatically until you cancel. By subscribing you agree to the Terms and Privacy Policy.

Already a member? Log in or open the app.

Works on iPhone, Android and computers. Add it to your home screen and it opens like an app, with the Mark It Sold intro.

FAQ

Questions

Do I need to download anything?

No. After you subscribe you get a link to the app. Open it in Safari or Chrome and add it to your home screen. It opens full screen like any other app.

Where is my trading data stored?

On your own device, in your browser. It isn't sent to us or anyone else. Use Backup to save a copy, and Restore to move it to another device.

Does it connect to my broker?

Not yet. You enter each day's P&L yourself, which takes a few seconds. The Match your account tool lets you type your broker's month P&L or balance and fills in the difference.

Can I use it for a company's fiscal year?

Yes. Pick the month your year starts in Settings and the yearly goal follows your fiscal year.

Does it track expenses?

Yes. Flip to the Expenses tab to log what trading costs you, with the sales tax on each receipt kept separate. It shows your profit after expenses for the month and year, and the Accountant report button gives you a PDF or spreadsheet of the whole year, ready to send.

Can I cancel?

Yes, anytime. Export your data to a spreadsheet first so you keep your history.